Note
Click here to download the full example code
Multi-parameter symbols
The pygmt.Figure.plot method can plot individual multi-parameter
symbols by passing the corresponding shortcuts (e, j, r, R,
w) to the style parameter:
e: ellipse
j: rotated rectangle
r: rectangle
R: rounded rectangle
w: pie wedge
import pygmt
We can plot multi-parameter symbols using the same symbol style. We need to
define locations (lon, lat) via the x and y parameters (scalar for
a single symbol or 1d list for servel ones) and two or three symbol
parameters after those shortcuts via the style parameter.
The symbol parameters in the style parameter are defined as:
e: ellipse,
direction/major_axis/minor_axisj: rotated rectangle,
direction/width/heightr: rectangle,
width/heightR: rounded rectangle,
width/height/radiusw: pie wedge,
radius/startdir/stopdir, the last two arguments are directions given in degrees counter-clockwise from horizontal
Upper-case versions E, J, and W are similar to e, j and w but expect geographic azimuths and distances.
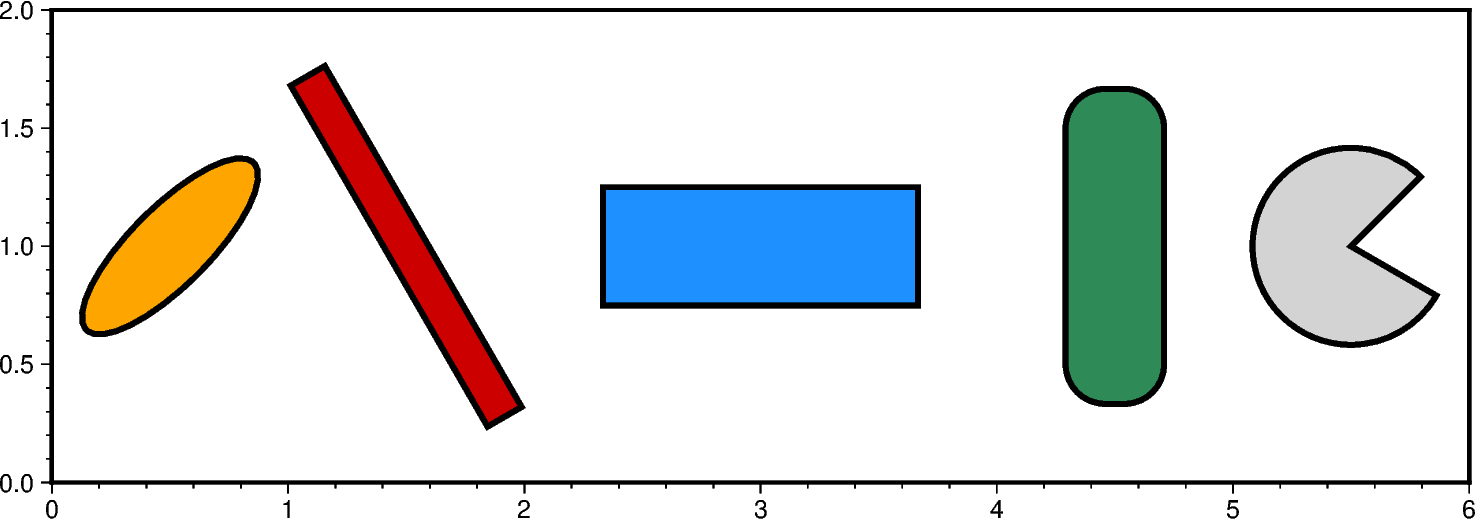
fig = pygmt.Figure()
fig.basemap(region=[0, 6, 0, 2], projection="x3c", frame=True)

# Ellipse
fig.plot(x=0.5, y=1, style="e45/3/1", color="orange", pen="2p,black")
# Rotated rectangle
fig.plot(x=1.5, y=1, style="j120/5/0.5", color="red3", pen="2p,black")
# Rectangle
fig.plot(x=3, y=1, style="r4/1.5", color="dodgerblue", pen="2p,black")
# Rounded rectangle
fig.plot(x=4.5, y=1, style="R1.25/4/0.5", color="seagreen", pen="2p,black")
# Pie wedge
fig.plot(x=5.5, y=1, style="w2.5/45/330", color="lightgray", pen="2p,black")

fig.show()
Out:
<IPython.core.display.Image object>
We can also plot symbols with varying parameters via defining those values in
a 2d list or numpy array ([[parameters]] for a single symbol or
[[parameters_1],[parameters_2],[parameters_i]] for several ones) or using
an appropriately formatted input file and passing it to data.
The symbol parameters in the 2d list or numpy array are defined as:
e: ellipse,
[[lon, lat, direction, major_axis, minor_axis]]j: rotated rectangle,
[[lon, lat, direction, width, height]]r: rectangle,
[[lon, lat, width, height]]R: rounded rectangle,
[[lon, lat, width, height, radius]]w: pie wedge,
[[lon, lat, radius, startdir, stopdir]], the last two arguments are directions given in degrees counter-clockwise from horizontal
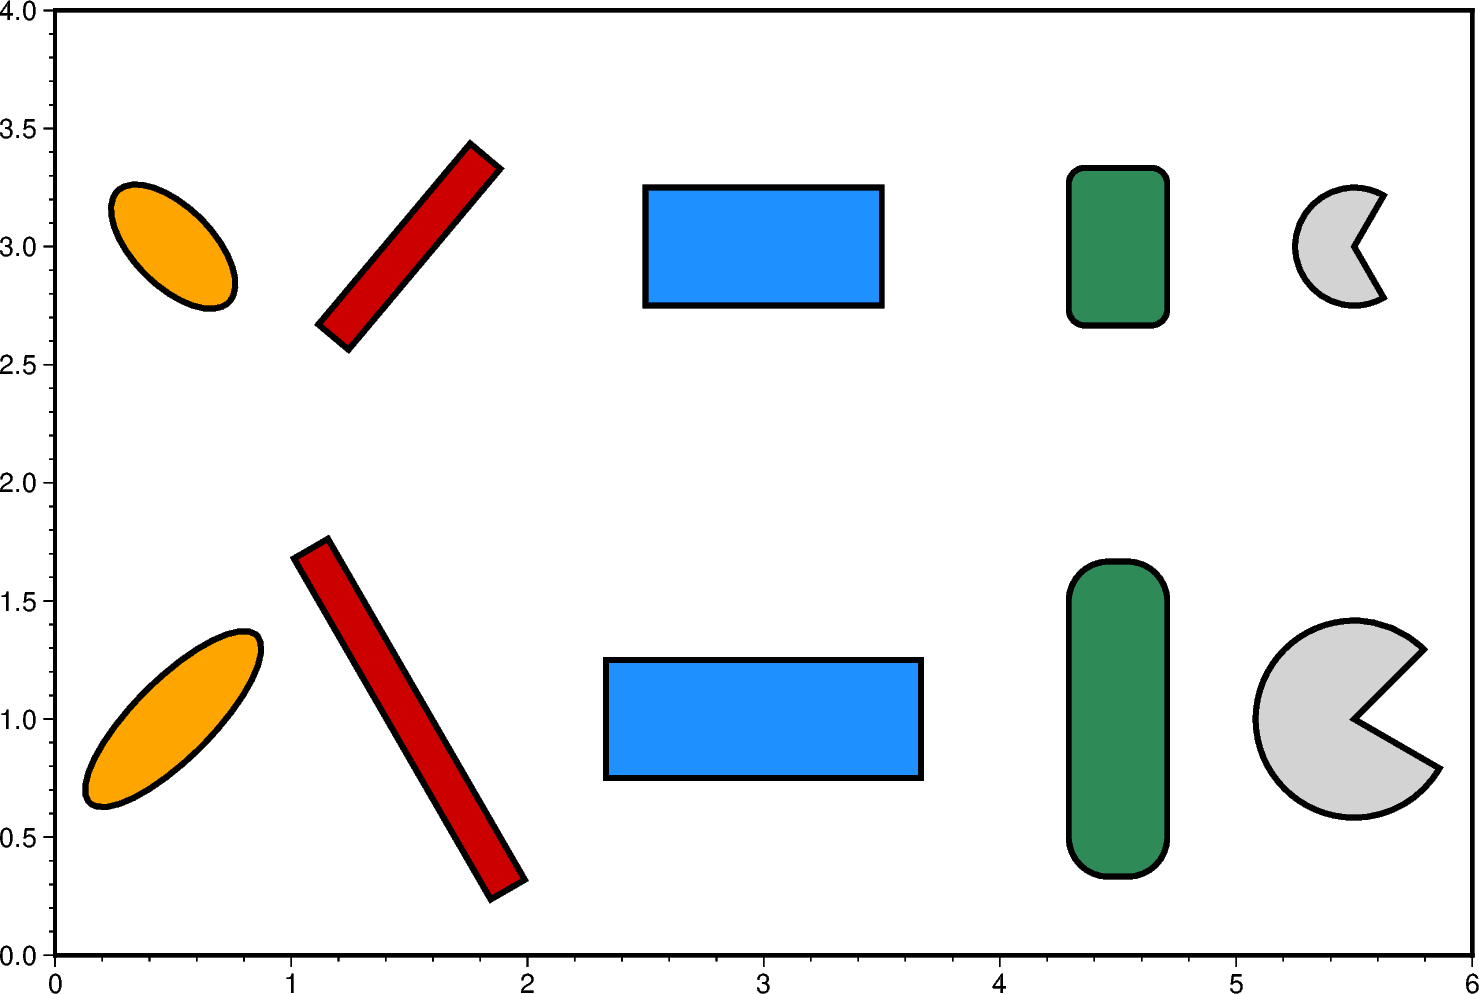
fig = pygmt.Figure()
fig.basemap(region=[0, 6, 0, 4], projection="x3c", frame=["xa1f0.2", "ya0.5f0.1"])

# Ellipse
data = [[0.5, 1, 45, 3, 1], [0.5, 3, 135, 2, 1]]
fig.plot(data=data, style="e", color="orange", pen="2p,black")
# Rotated rectangle
data = [[1.5, 1, 120, 5, 0.5], [1.5, 3, 50, 3, 0.5]]
fig.plot(data=data, style="j", color="red3", pen="2p,black")
# Rectangle
data = [[3, 1, 4, 1.5], [3, 3, 3, 1.5]]
fig.plot(data=data, style="r", color="dodgerblue", pen="2p,black")
# Rounded rectangle
data = [[4.5, 1, 1.25, 4, 0.5], [4.5, 3, 1.25, 2.0, 0.2]]
fig.plot(data=data, style="R", color="seagreen", pen="2p,black")
# Pie wedge
data = [[5.5, 1, 2.5, 45, 330], [5.5, 3, 1.5, 60, 300]]
fig.plot(data=data, style="w", color="lightgray", pen="2p,black")

fig.show()
Out:
<IPython.core.display.Image object>
Total running time of the script: ( 0 minutes 3.397 seconds)